After our successful appearance at WHAT datathon we decided to try our skills again and, together with an old friend of mine Konrad Banachewicz from TNG Quant Consultancy, we took part in Eneco’s Predictive Maintenance Challenge, a part of Dutch Data Science Week 2017. And yes, we won again!

BUSINESS VALUE
The competition was fierce and there were many great models created. The reason the jury selected us as the winner was the business value our solution provided. Quoting Ronald Root, the head of the jury:
In the end, it’s not about the modeling techniques, but about the business value that the data can provide. The team who understood it best was Codersco/TNG.

THE CHALLENGE
One of Eneco’s subsidiaries, Luminext, collects data about approximately 10% of streetlights in the Netherlands. The data contains information about the location of the streetlight, type of the bulb, installation date and a the number of burning hours to date. For lightbulbs that were replaced due to malfunction, the information about the replacement date and total number of burning hours was stored.
Eneco prepared an assignment description with many questions, which basically boiled down to two goals:
- reducing the cost of maintaining the streetlights (directly impacting Eneco’s bottomline)
- reducing the number of dark hours (directly impacting ‘customer’ experience :-))
According to Eneco, currently, maintenance runs based on a schedule. Or worse, by a surveillance car that drives around the city to spot broken lights. This makes the maintenance chain inefficient, leading to more unlighted areas and higher costs to maintain the streets lit.
The question we asked ourselves was how can we use the data to help the maintenance team the most, what is the low-hanging fruit?. We envisioned a tool that will help with the resource management and planning by answering the following questions:
- In which area should we replace the bulbs first?
- Which areas will need maintenance in the coming two months.
- How many areas will that be?
THE MODEL
The heart of such a tool is a model that based on the available data predicts the number of hours-to-live for each installed lightbulb. The leading role in constructing the model fell to Konrad, a seasoned data scientist. After quickly cleaning the data (apparently ‘Philips’ can be spelled in three different ways ;-)) he promptly discovered that the year of installation of a bulb is a best predictor for the time-to-live… After a short discussion with the organisers we discovered that this is an artefact in the data introduced by the way the data was sampled. Unfortunately, this is often a fact of life: the available data is often biased and incomplete and we have to find ways around it.
Luckily, our own Artem came up with an idea on how to integrate the data from the lightbulbs that are still burning. This greatly helped with alleviating the bias. Based on that, Konrad created a linear-regression model that shown that the best predictors for the lifetime of a bulb are:
- The burning hours reported by the manufacturer (yes!)
- The geographical location
MAKING THE MODEL ACTIONABLE
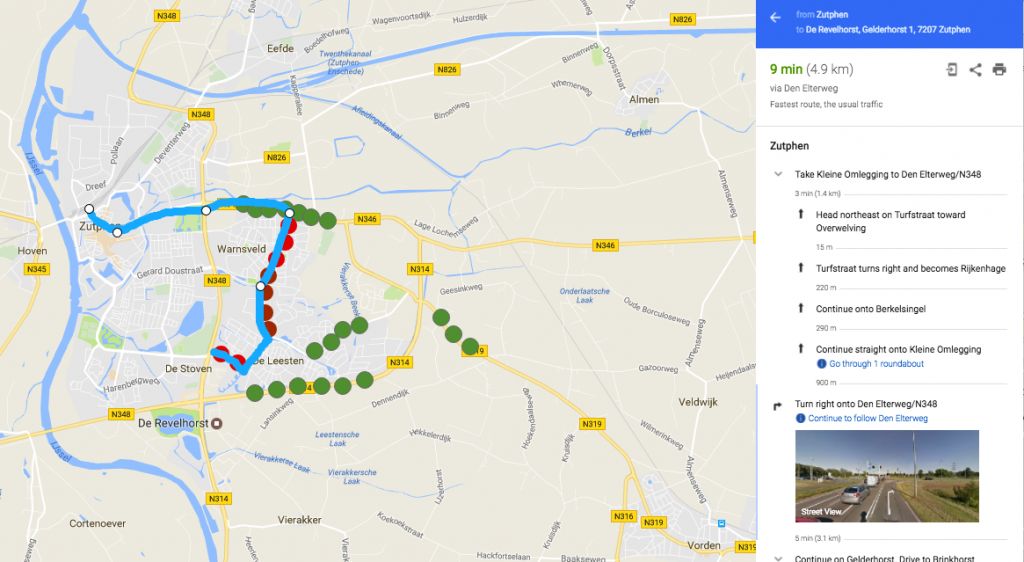
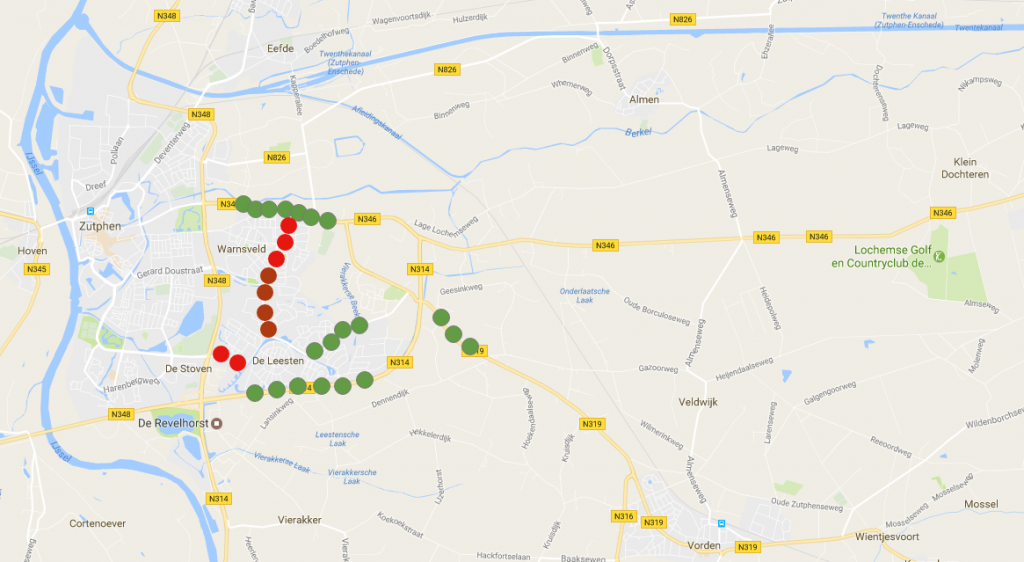
In the meantime, our new colleague Ruben was quietly working on a Google Maps-based visualisation. Gosia used Rax to compute the urgency of replacement for each lightbulb based on its predicted time-to-live. Ruben displayed this data on a map which clearly shows which areas will need attention soon. The map was similar to this one (we cannot show the real one due to data-protection concerns):
To make it even easier for the decision makers, Ruben used Google’s API and Rax to translate geographical coordinates into postal codes, and Gosia wrote a simple Rax script that ranks the postcode areas by their maintenance urgency:
{[$:postcode, #:tot_hours, #:num_lights, #:num_overdue_lights]} : postcode_htl :=
    fold [.postcode, /sum(.hours_to_live), /count(), /count(.hours_to_live < 0)]
    life_per_postcode;
  `print postcode_htl![.tot_hours][1..100];
Which resulted in a list similar to this one (again, not the real list):
postcode|tot_hours|num_lights|num_overdue_lights
--------+---------+----------+------------------
 "4081" | -264374 |    157   |        144
 "5406" | -261212 |    227   |        174
 "5002" | -237262 |    183   |        148
 "6613" | -206239 |    160   |        129
 "7041" | -156785 |    142   |        130
 "7253" | -152471 |    130   |        109
 "4184" | -134948 |    85    |        83
 "4196" | -132672 |    91    |        89
 "6926" | -127912 |    168   |        100
 "6882" | -127064 |    90    |        84
--------+---------+----------+------------------
Combining the predictive model with simple metrics and visualisations like the ones above can already be a great help with planning the maintenance resources. With a little bit more effort, one could implement a tool that would provide suggestions for maintenance drivers’ schedules and routes:
| Name | Date | Route | Bulb type |
|---|---|---|---|
| Jan Van | 2017-07-20 | Zutphen | 44xCDO-TT 150, 21xCDO-TT 70 |
| Gosia Busje | 2017-07-20 | Alphen a/d Rijn | 87xCDO-TT 150 |